Traders have been using Elliott waves theory (is not a theory anymore in my opinion) for decades. Although the rules and guidelines are quite simple to understand, it becomes a daunting task to implement it in the actual day-to-day trading.
Today’s lesson is about how to trade using Elliott waves. I will show you exactly how I implement Elliott waves in my forecasting and actual trading.
Example NZDUSD short trade using Elliott waves
This is a real trade using Elliott waves. No hindsight analysis. All the images posted on this article are directly from the Trading View platform and stamped with the time of the screenshot. I always use the KISS philosophy. So my approach to trading is really simple. I use a number of strategies and indicators, but never mix up strategies on a single trade. If you too are trading many strategies, you must be able to attach each trade to only a single strategy.
So this is my trade call using Elliott waves.
NZDUSD is in a strong downtrend of higher degree. On the weekly and Daily chart, the 4th wave correction has ended with a simple ABC correction. Since we have counted a possible end of the 4th wave, we will be looking for the 5th wave to the downside.
Since we have perspective from the weekly time frame, lets drill down to lower time frames to catch the action of trends and structures in lower degrees.
Lets have a look at the Daily.
Once I zoomed into the Daily, it was clear that the ABC correction of the 4th wave is not entirely accurate. Because the C wave failed to break the high of the A wave. I still could have counted it as a C wave truncation. But wave truncation (either C wave or 5th wave) are very rare. I only opt for truncation when there is absolutely no alternate counting options. So I changed my ABC count to a contracting triangle.
Either way, price has violated the bottom structural trend line. So we can safely assume that a move down is due.
Lets go further down to the 4H
Corrective structures are not always simple ABC patterns. More often than not, we see more complex combinations in a correction. None the less, we have so far established that one wave of ABC is complete on the 4H time frame. So we are looking for a move down, at least another corrective ABC wave. The idea is to catch the trade at the start of a possible impulse move on a higher degree. Once we are in the trade, we can study the personality of the wave and decide if the move is another correction or an impulse.
Here’s a 1H view of the structure:
In the 1H time-frame we see a nice flag setup, looking to break to the downside. This is the opportunity to enter short. But not so fast.
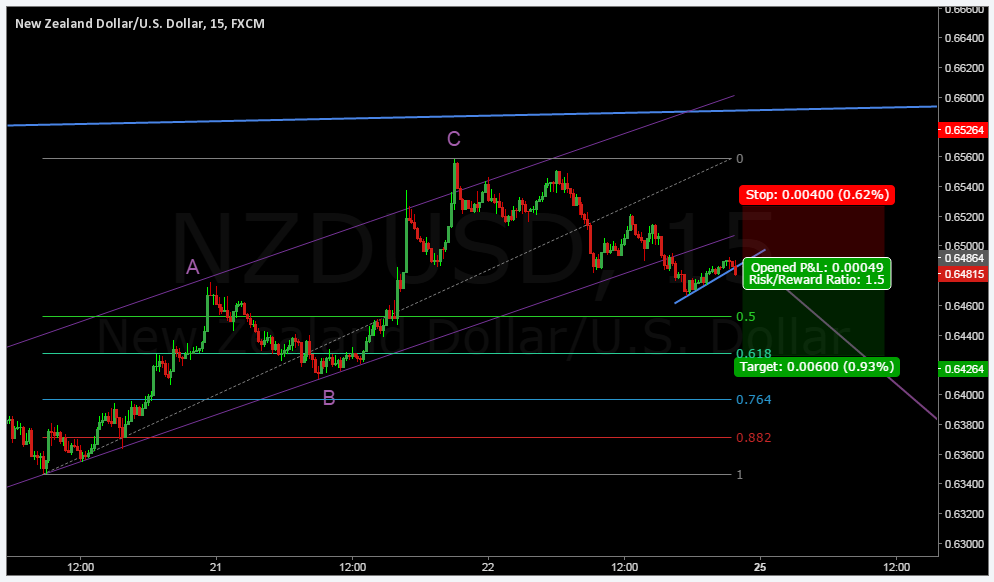
To actually decide the entry, stop-loss and take-profit levels, we have to go down to the 15min time frame.
At this point we can use numerous methods and indicators to pinpoint our entry. The important question is, where would the stop-loss and take-profit levels be placed? We started by looking at the trend and the wave count of the weekly chart. So ideally, the risk and reward levels must be based on the weekly time frame. But herein onward all depends on the personal risk apatite of the trader.
My risk apatite is not so big. So I would prefer to enter a more conservative trade based on lower time-frames. Keeping the wave count of higher degrees in mind, I would manage the trade depending on the wave personality of the down move. That is, if we get the down move as we expect.
Using Elliott waves is an amazing prospect for trading in the direction of the trend as well as the corrective structures. But there are times when you can’t make sense of a chart in terms of Elliott waves. It’s best to ignore those charts and concentrate on the ones that has a clear wave structure. Using Elliott waves can boost your trading, only if you do it with a methodical approach.
If you have a different view on my approach to using Elliott waves or the actual trade call itself, please feel free to drop a line or two in the comments below. If you like this article, don’t forget to share it with your friends and colleagues.