
Lets face it. Getting a sense of direction on any chart is not an easy task. But it’s not impossible. Especially, when we combine Elliott waves theory with Harmonic patterns and Fibonacci ratios for example.
Elliott waves theory (I believe it’s not a theory anymore, but a proven strategy) is an excellent method to study waves. The wave count is the most important part. If you have the correct count at any given time, you can expect the next move with astounding accuracy. Here lies the problem though. How do you know if your count is correct? Well, that’s for the price to reveal. In other words, you will only know after the next move. Your job is NOT to be correct but to have a probable expectancy for your next trade. And Elliott waves could do wonders in that aspect.
The next part of the puzzle is – using Harmonic patterns on the chart. Here’s the thing. You have to have a feeling for the direction you are expecting the price to move, to pick the right ones to trade. If you can pinpoint certain patterns with an underlying theory to support the direction (for example Elliott waves – count of the waves.) then the pattern has a high probability of panning out.
Fibonacci ratios are an excellent tool to locate entry and exit points – the final piece of the puzzle. Although ‘The wave principle’ teaches us basically how the market moves, Fibonacci ratios help us locate price points where the impulses or corrections are likely to start or end.
If you want to learn more about Elliott waves have a look at – elliottwave.com
Elliott Waves, Harmonics, and Fibonacci ratios – a great combination for a strategy
If you can devise a strategy combining all three of these wonderful elements, it will be the ultimate strategy. Simply because it would have all the right ingredients for a successful strategy.
The most important phase of trading is to:
- Determine the current market condition.
- Forecast or expect the next impulse wave.
The first point means understanding if the price is in a trend or a corrective structure. The second point is to understand probabilities about price turning points and direction. Elliott waves help cover both these fundamental elements of a trade.
Harmonic patterns are a great method to add precision and confirmation for trade entries. Since harmonic patterns often appear within corrective wave structures, it’s a handy tool to catch following impulse waves. If you are using both in combination, you would have identified corrective structures using the Elliott waves rules and guidelines. This will be your edge.
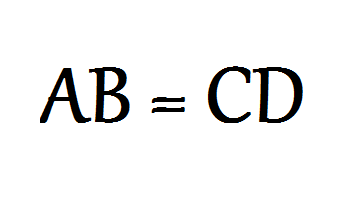
All that is left is to define risk, entry price, and target price levels. For this, we use Fibonacci retracement and expansions. For example, 61.8% retracement of impulse waves is highly probable in corrective wave structures. Waves are also subdivided into further 3 and 5-wave combinations of lower degrees. So it’s fairly easy to find multiple occurrences of harmonics. You would find at least one instance of the basic AB=CD pattern.
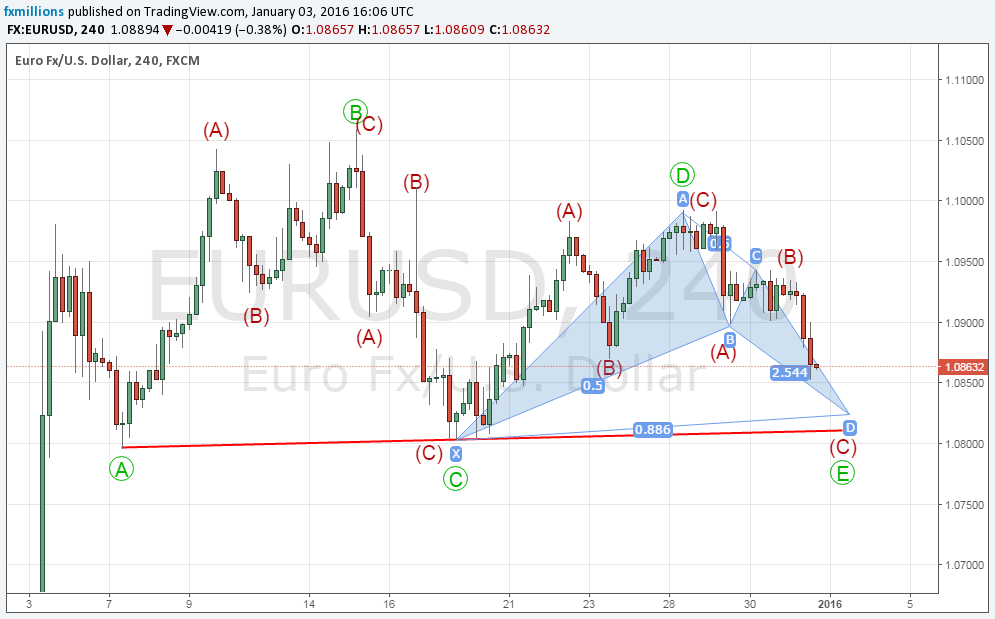
Here’s an attempt to combine these elements into a trade. In this example we have used Elliott waves and a possible BAT pattern completion as a strategy to forecast the next impulse wave. Fibonacci levels will be used to pinpoint entry, SL and target levels as and when price action confirms the forecast.
EURUSD – Possible triangle completion with a Bat confirmation. by fxmillions on TradingView.com
This trade might or might not be triggered. But it has a high probability. I know this combination of Elliott waves, Harmonics, and Fibonacci ratios are so powerful and rewarding thanks to all the backtesting I have done.
So do you trade Elliott waves or harmonics? You may share your thoughts in the comments section below. What do you think of this combo strategy of Elliott waves and Harmonics?