Have you ever been in a situation where the market reverses in the opposite direction, as soon as you enter a trade? Have you ever wondered, “only if I had taken the opposite side on all my trades…”? Do you feel like the market is always against you, no matter what? If you answered yes to any of these questions, chances are you are picking trades at the end of trends.
Yes, we’ve all heard the saying that every forex tutor never fails to mention…
The trend is your friend (, until it ends)
Just a sarcastic phrase is not helpful for any of us. Therefore, I explored things further.
What exactly is a trend anyway
It is the direction that the market moves at any given timeframe. Pretty simple, right? But here’s the caveat – it’s highly subjective. Meaning what you consider to be a trend, may not necessarily be one for another trader. Definition of a trend can drastically change, depending on the context and timeframe in question.
But the problem is not about identifying a trend, but identifying a trend at the beginning. Even my 6 year old daughter can identify a trend when it’s complete. Hindsight trading doesn’t make you any money. So learn or develop your own methods to determine the start of a trend (or a wave within a trend.)
So how to objectively identify trends at the right time? Before all that…
A note about price extremes and reversal points
Logically speaking, in order to identify the beginning of a trend in a certain direction, you must know when the preceding trend ends in the opposite direction. In other words, pick the top or bottom. Many if not all “professional” traders oppose the idea of picking tops or bottoms. They also say, that you should:
Buy low, sell high
This is surely a conflict of interest if identifying price extremes is a forbidden task.
Perhaps, the concept they oppose may be trading against the trend when the trend is strong. But that sort of amateur approach is obviously objectionable. No serious trader would trade against the trend, unless of course there is conclusive evidence to support a reversal. So the question now is to identify and evaluate certain attributes of trend in order to understand its beahvors at certain levels such as trend continuation, short term retracement or reversal.
Identifying exhaustion of the current/preceding trend and the start of a new trend are the basic foundation of trading.
I don’t recommend that you blindly pick extremes in markets, and just hope that the price would reverse in your favor. Not at all!
On the contrary, you must have a method to determine highly probable extremes in a chart. Otherwise, it brings a whole lot of other problems to the table – like risk to reward; entry and exit points etc. Again, this is down to context and strategy. But one of the the purposes of any strategy is to find price extremes, one way or the other.
However it does not mean that you have to pick the “very” extreme. Strategies using confirmation-entry too are just fine as long as it has a built-in method to identify alreadt established price extremes, reversal points etc.
That is all we traders do; identify (potential) lows and highs. No matter how you name the process, it is still the process of picking tops and bottoms.
Yes, it’s a great theory, but how would you know which is low and which is high, you may ask. Well now, that’s a million-dollar question, right there!
Practical methods…
The problem is, most retail traders are stuck to one timeframe and they have no clue about the action on other timeframes above or below. The trick is to isolate motive and corrective waves on multiple contexts and timeframes.


Even strong trends are bound to have pullbacks and corrections at certain points. The price never moves in a straight line. Seemingly a trend in a lower timeframe could only be a pullback or a correction in a higher timeframe.
A good starting point would be to analyze ZigZag wave patterns within a trend. Study the waves towards and aginst the direction of the trend in question. Then go to the timeframe below to find possible trade opportunities in the direction of the larger trend.
I never said it’s easy. But if you grasp the concepts in this post, I guarantee that you will see substantial improvements in your trading.
Trajectory of waves
This is often an unspoken characteristic of trends. If you can manage to dissect a trend down to partial waves, you should see the changes in trajectory within those partial waves.
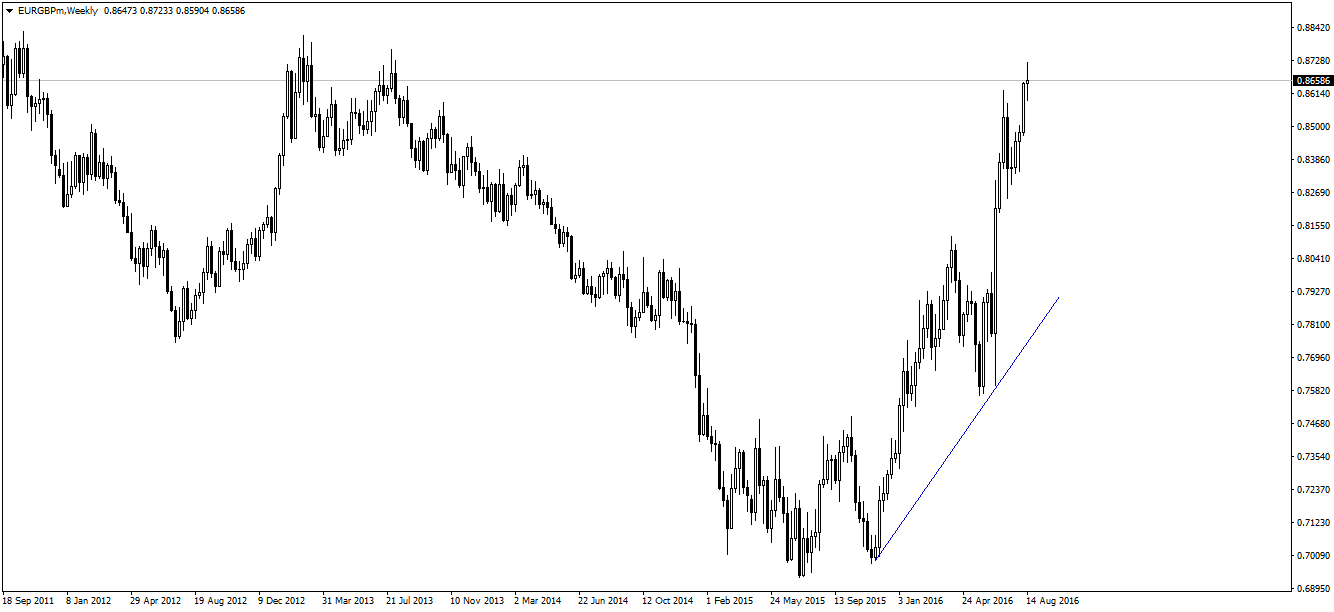
The angle in each mini wave within the trend, tend to slant more and more towards the horizontal axis, as the momentum diminishes or vice versa. This typically shouts that the trend (or a sub wave of a bigger trend in a higher timeframe) is getting exhausted.

Last wave in the above Weekly chart zoomed in the Daily chart:

Last wave in the above Daily chart zoomed in the 4 Hour chart:

Now you know where I’m going with this. If you follow the pattern, you can see that there is still some room left for long trades. But as soon as the trajectories show decreasing momentum in H4, it would mean the weekly chart is preparing for a correction. The daily chart has already given the signal.
However the wave trajectory and angles are not an absolute indication. At times they can be misleading and unclear. But when they do work, they are a solid indication of strength or weakness of the trend.
Distance – time correlation
Correlation of distance and time is another dimension of the same trajectory concept discussed above. It is literally the amount of time consumed to cover a certain pip-length in minutues, hours or days (depending on the timeframe you are trading.)
In one word, this is called the momentum. The definition of momentum in Forex is no different to that of Physics. Just that in forex the length is measured in pips as opposed to centimetres or metres in th real world.
This is again a helpful indication of increasing or decreasing strength of a trend.
Fibonacci retracement levels
Fibonacci measurement is useful to forecast possible levels where a corrective wave is more likely to end. In a strong trending market, probable retracement levels are ususally below 50% (38.2% or 23.6%.) On the other hand when the momentum of a trend is dying out, retracement levels are more likely to be above 50% (61.8%, 78.6% or 88.2%.)
The momentum here is referred to the momentum of the overall trend and not those sudden spikes within partial waves. Often called as news spikes, these temporary price hikes are usually retraced closer to the initial pre-hike price. Rgardless, it isn’t practical to measure a news-spike, nor the retracement, in fib ratios.
If used correctly in accordance with other attributes of a trend, fib ratios are very effective to enter trades with a lucrative R:R profile, in the direction of a trend.
Moving Average
We know that moving avaregs are least effective to spot trend reversals; in the sense that a ma-crossover or candle close alone can never be a significantly decisive factor in any market. But unfortunately this is the first strategy that every trader learns in the beginning.
On the other hand moving averages are very effective in revert-to-mean strategies. Revert-to-mean strategies are those that identifies end of corrections or pullbacks within a trend; in order to execute trades in the direction of the trend. Moving averages are very useful in this context, only if you know how to use it.
First rule is that the moving average period is a variable. Therefore you have to select the ma period according to various factors – current market conditions, strength of the trend, past performance of the selected ma period and timeframe.
Here is an elaboration of the above statement.

See the main point here is that time period of the moving average that would act as the mean point for the trend would be impossible to predict beforehand.
Ichimoku
Ichimoku is another popular indicator that combines various moving averages with different period and shift settings. This combination produces nice overlapping zones called as clouds. This also forecasts certain high probability levels that price is likely to stall before a reversal or at the start of a new trend in the opposite direction.
In any case, indicators based on moving averages and shifts are lagging by nature. As with every other indicator, the forecast and expectation is based on past data. But past data is all we have to analyze a chart. Again the trick is to analyze different time windows and fractals of the same data.

EURGBP wekly chart

In the spirit of looking for trend exhaustion, this Daily chart of EURGBP shows a deep pullback into the clouds. But there is no sign of exhaustion in the weekly chart except for couple of candles in the opposite direction. Analyzing lower timeframes could give us a potential directional bias. However the purpose here is not to forecast EURGBP price. This chart is merely an example using Ichimoku to show how the context of trends and corrections change in different timeframes.
MACD
MACD convergence and divergence is another sleek method to spot trend exhaustion and reversal zones. But first you have to understand that MACD itself is the convergence and divergence of the Moving Average. So for example divergence in MACD is in fact convergence or divergence to the power of 2 in the basis of Moving Averages.

Again here is a nice example in the EURGBP daily chart. As beautiful as it may look, this is not a trading strategy on its own. I have seen many a times amateur traders being taught this as a strategy to “execute” trades. These are mere tools to identify strengths and weaknesses of an ongoing trend.
MACD divergence is just a warning sign to say that the trend is getting weak and a correction or a reversal is due soon. So in this particular EURGBP chart, it would have been a strong signal to avoid any pending long trades as well as exit all open long positions.
Conclusion
In a nutshell, successful trading requires a proven methodologies to identify price extremes, trends and trend reversals. Not necessarily the very top or bottom; but at the very least, identification of strength, momentum and potential of trends is a must. MACD divergence, Fibonacci levels and mean revertion are my personal favorits.
But it’s of no value to identify a trend when it is complete. Hence the tools and methods described in this post become very useful to recognize trend exhaustion and possible trend reversal zones paving the way to catch the start of the subsequent trend or wave to the opposite direction.