
It’s been a while since my last post. It’s because I have been quietly developing a custom indicator to spot directional bias as well as subtle changes in momentum for both directions. Let me just say, the results are amazing in testing and you can have a peek at it in this very post.
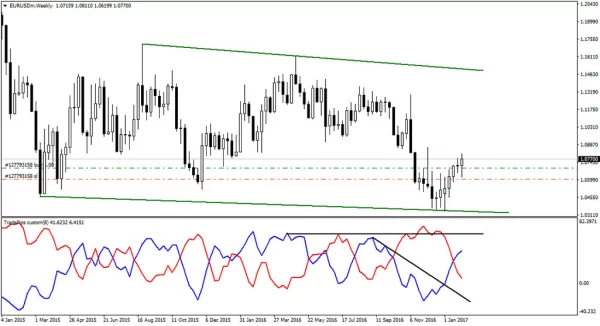
Obviously the only indicator attached is my Trade Pips custom indicator. The blue line represents the bullish strength and the red line – the bearish strength. Apparently, the blue line has been the dominant entity for the last few weeks. But we did not need the indicator to read the dominant direction as it’s quite obvious if you look at the last few weekly candlesticks. However, pay attention to the slanted black line that represents the previous bearish trend (or the diminishing bullish strength.) This is where the indicator becomes handy to spot directional bias and more importantly changes in the direction.
The signal
The breakout above the slanted black line was a signal for a directional change. Too bad that was exactly the 1st of January 2017. Neither I was trading during that period nor was the indicator functional then. Too bad because this means more bad news for the USD this year, and not because I couldn’t take the trade.
Another important factor is that the indicator clearly displays how price does not travel in a straight line. So very soon we may see a correction (where the blue line would retest the slanted black line.) Ultimately the expectation is for the blue line to reach the horizontal black line which represents the previous most significant highest high.
Elliott waves analysis
From Elliott waves‘ point of view, the overall pattern will more like be an ABC-Flat or WXY. Either way, the price is currently in a bullish trend. In my earlier posts (from months back) I expected this structure to be a triangle. US election plus post-election volatility combined with low liquidity holiday markets took the price way below the lowest low of the structure. Which means the triangle structure is a no-go. Nonetheless, the price will more likely continue towards the anticipated structure highs, only as the C or Y wave of a three-wave structure.


