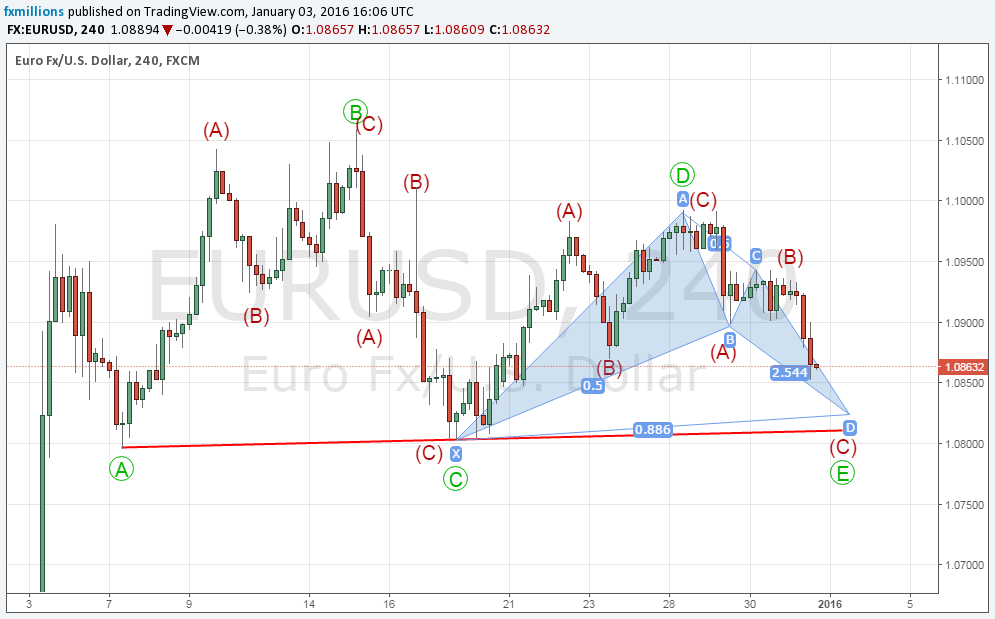
WXY Elliott wave is a 3-wave corrective formation which is also known as the “Double three combo”. It is called a “double three” because it includes 2 main corrective waves (W and Y) combined by a sub wave (X) in between. WXY correction can be similar to an ABC correction because they both consust of 3 waves.
However, the ABC ZigZag can be sharp, steeper moves while WXY are prone to appear more on sideways markets.
The W and Y are the main corrective waves combined with a possibly smaller corrective wave (seemingly of a lower degree, but not so…) labeled as the X. So the length and depth of wave X can be quite same as a wave B (subdivision) within the W or Y.
Jump to the Bitcoin (BTCUSD) forecast of an ongoing WXY formation
Corrective waves are inherently difficult to label compared to the impulse waves. Corrective structures can also start with a sharp wave that can be mistaken for the start of an impulse, increasing the difficulty in forecasting. Because of these reasons, personally I would not anticipate a WXY until after the completion of a possible W and X waves.
At the end of a corrective structure, the obvious anticipation is for the next motive wave. But if the price stalls and continues in the sideways market, this could be a sign of an extended WXY (double three) or WXYXZ (triple three) combo correction.
WXY Rules
All three W, X and Y waves are corrections – either 3 (ABC) or 5 (ABCDE) wave structures. Obviously each of the W,X and Y legs should respect the rules that govern its own corrective structure.
- W and Y subdivisions can be ABC or ABCDE in the smaller degree.
- X wave subdivision also comprises of any corrective structure, but the context is much like of an even smaller degree.
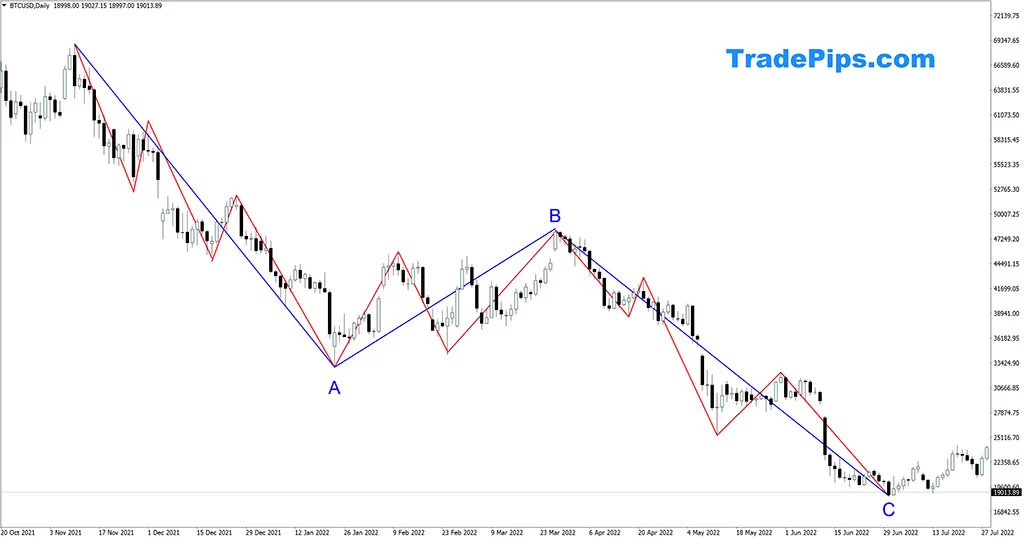
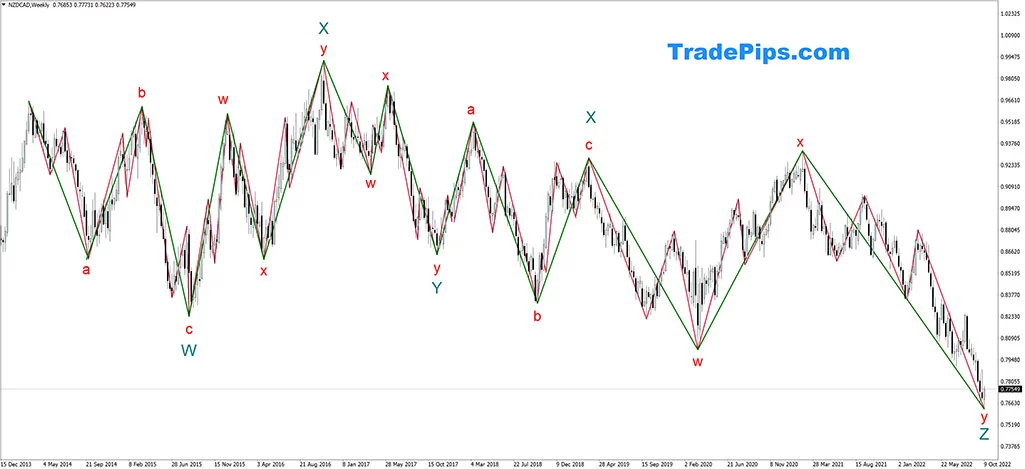
Bitcoin forecast on W1 chart (possible WXY formation)

In a previous post I mentioned the ABC ZigZag completion of the Bitcoin. Anticipation then was for the bullish motive wave to begin. However, the extended sideways market has formed an expanding flat that marks the X wave of a possibly ongoing WXY correction.
The length and depth of the possible wave X is perfectly fitting compared to the possible W wave (ABC correction). According to this forecast, the massive bullish trend of Bitcoin that everyone is eagerly waiting for, will not start at least until the start of 2024.
update 12/03/2023 : Already bearish BTCUSD dropped even more sharply confirming to the above forecast, following the debacle of SVB bank collapse.
In conclusion WXY is a complex corrective-wave-structure and it can extend to the prolonged 5-wave correction of WXYXZ. These combo structures, by nature, are formed within extended sideways markets.
Although it’s not advisable to label incomplete WXY wave corrections, current Bitcoin (BTCUSD) weekly chart appears to have formed the W and X waves of a possible WXY combo correction. In every case the Bitcoin example does not warrant any trade opportunity, as the sideways market of the BTCUSD continues.
Read the complete guide to the Elliott Wave Principle
Resources
- WXY diagrams and other related images images collection of Google results for WXY (double three)